First structured protocol that transforms POS photos into auditable evidence. 12 practical steps for industrial field teams.
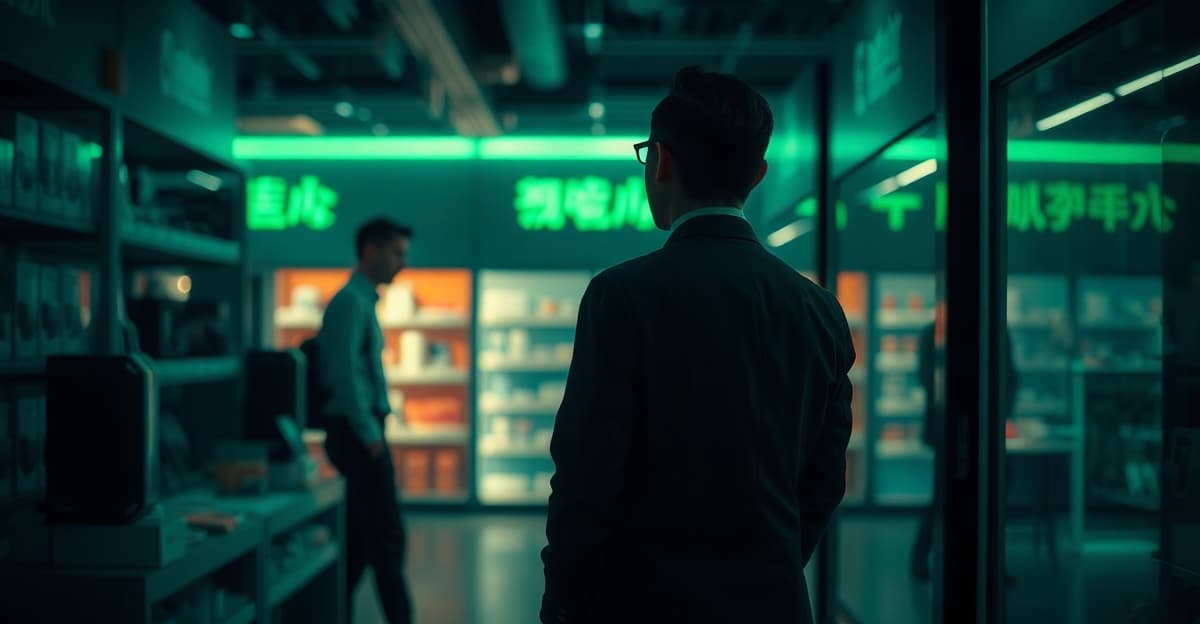
Your field promoter sent 47 PDV photos. The trade manager reviewed each one and rejected 38 — wrong angle, no competitive context, impossible to measure share of shelf.
The question no one wants to ask: why are 78% of field photos rejected in audits? It's not team laziness. It's because no one taught that PDV photos aren't just "records" — they're auditable evidence that must enable quantitative indicator extraction.
This protocol exemplifies Knowledge to Action: transforms technical PDV knowledge into standardized execution that generates actionable data. These are 12 structured steps that convert smartphones into commercial intelligence tools. Not "photography tips" — specific technical standards by industrial category that reduce rejection from 78% to less than 15%.
Minimum technical equipment
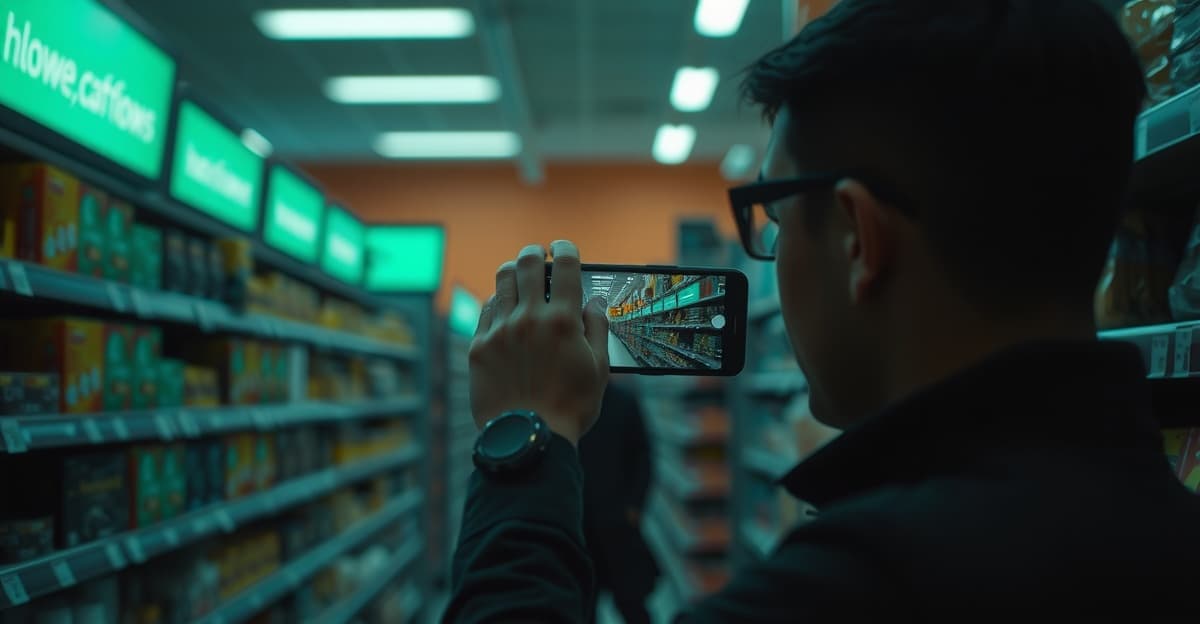
Smartphone with at least 8MP camera and functional LED flash. Lower resolution prevents price reading in zoom — technical criterion, not preference. Capture app with automatic timestamp and activated geolocation. External battery or portable charger for long routes. Lens cleaning cloth: removes reflections that invalidate competitive presence analysis.
Operational credentials and access
Updated point list with exact addresses and responsible contacts. Active credentials in company's PDV management system. Basic knowledge of direct and indirect competitors by category — you need to recognize what you're photographing.
Timing isn't preference — it's technique. In projects we track, optimized timing reduces lighting issues by 67% and increases competitive analysis accuracy:
In a beverage sector client project, adjusting capture time from 9am to after 2pm reduced photo rejection for inadequate lighting from 45% to 8% in 30 days. This optimized timing demonstrates how Knowledge to Action works: knowledge about retailer behavior transforms into execution protocol that impacts collected data quality.
Estimated time per category: 8-12 minutes for food, 15-20 minutes for beverages, 5-8 minutes for hygiene/beauty. Rush kills quality — and quality determines if the record serves for audit.
1. Lighting and movement reconnaissance Identify natural light sources, lamp positions and customer flow before starting capture. Customers in frame invalidate share measurement — wait for less movement or return at appropriate time.
2. Complete section panoramic photo Capture general view of entire gondola/cooler at eye level (1.6m) including at least 3 competing brands. This photo serves to calculate total share of shelf — without it, analysis remains incomplete. Right angle, never tilted.
3. PDV identification Photo of facade or clear establishment identification sign with visible name/address. Proves you were physically at the correct location — prevents subsequent management questioning.
4. Timestamp and GPS verification Confirm that date/time and geolocation are automatically capturing in each photo. Evidence without timestamp is rejected in audit — configure before starting.
5. Brand main facing Perpendicular frontal photo showing exact quantity of faces occupied by each brand SKU. Right angle is essential — tilted photos distort facing count. Distance: 1.5-2 meters to avoid distortion. Here we see Knowledge to Action in operation: knowledge about share measurement converts into specific technical capture standard.
6. Lateral competitive context Capture products to the left and right of your brand to map space occupation strategy. Adjacent competitors influence purchase decision — evidence serves to optimize future positioning.
7. Price and promotion recording Specific photo of all price tags for your brand and main competitors in section. Sufficient zoom for value reading — relative pricing is critical positioning indicator. Without visible price, photo is useless for commercial analysis.
8. Exposure height Document if products are at eye level, below or above natural sight line. Inadequate height reduces sales — evidence serves to negotiate better positioning with retailer.
9. PDV materials and visual communication Record all elements: displays, posters, stoppers, gondola rulers. Damaged or poorly positioned material needs to be evidenced for correction. Well-executed material increases sell-out by 15-25% depending on category.
10. Out-of-stock and low inventory signals Photo of empty spaces, products with only 1-2 units or with visible near expiration. Photographed out-of-stock becomes evidence for additional space negotiation or mix review.
11. Category-specific controls For beverages/dairy: temperature display photo always visible alongside products. Inadequate temperature invalidates all exposure work — it's mandatory auditable item.
12. Immediate upload with stable connection Send photos to system while still at PDV to avoid data loss. Poor connection corrupts files — use establishment Wi-Fi if necessary. Batch upload at end of day is recipe for evidence loss.
Backlit photos or with reflection — Prevents price reading and product identification. In a food sector client project, visual protocol implementation reduced photo rejection from 74% to 12% in 60 days. Always position yourself with light source behind you, never photograph against windows or lamps.
Framing without competitive context — Prevents share of shelf calculation and relative positioning analysis. Always include at least 2-3 competing brands in same frame. Isolated photo of your brand has no analytical value.
Tilted or too close angle — Distorts facing count and occupied space measurement. Keep camera perpendicular to gondola, minimum distance of 1.5 meters.
Capture during stock replenishment — Photo doesn't reflect real exposure situation for consumer. Wait for replenishment completion or return at appropriate time. Rush kills evidence utility.
Missing price references — Without visible tags, impossible to perform relative pricing analysis. In hygiene and beauty client implementation, price capture standardization enabled identification of 34% of previously undetected discrepancies, resulting in negotiation that recovered 8% average margin.
The problem isn't just operational — it's strategic. Management without reliable evidence cannot optimize mix, negotiate spaces or prove campaign ROI. The structured PDV visit protocol solves part of the problem, but without visual standard, data remains incomplete.
How to measure: Count your brand's facings divided by total category facings in panoramic photo. In projects we track, share of shelf measured by photo versus on-site audit shows 91% accuracy when specific framing standards are followed.
Derived indicator: Competitive presence by zone (left, center, right of gondola). Products positioned in center have 23% more turnover — visual evidence enables mapping and negotiating better positioning.
Planogram compliance: Compare current product position versus official planogram through facing photos. In snack client project, structured visual protocol increased planogram execution compliance from 67% to 89% in 45 days.
Inventory turnover signals: Identify through photos products with low stock, empty spaces or near expirations. This visual analysis enables detecting demand patterns by PDV and optimizing replenishment. This connectivity between visual data and operational indicators exemplifies Knowledge to Action: information captured in field feeds strategic replenishment and mix decisions.
The difference between amateur recording and professional evidence lies in technical details. In projects we track, teams following structured protocol reduce field rework by 52% and increase point coverage by 28% — because each captured photo serves for analysis, doesn't need redoing.
Quality index per promoter: Calculate % of accepted photos versus total captured. Goal: reduce rejection from 78% (market average) to less than 15%. This transforms audit cost into competitive advantage.
When visual evidence follows auditable standards, field training stops being cost and becomes commercial intelligence system. PDV execution goes from "checklist completed" to data that feeds mix, pricing and space negotiation decisions — Knowledge to Action converting execution into strategic insights.
Managers who implement structured PDV indicators can prove campaign ROI in 90 days — not in end-of-year "feeling".
Want to structure visual protocol that connects PDV photos to your trade marketing indicators? In 15 minutes we'll show you the best plan for your operation. Schedule a demonstration — no commitment, you leave with complete diagnosis.
Tell us about your operation and we'll build the roadmap together.
Talk to our team